

Power Quality Analysis in Jaipur & Rajasthan
Logged measurement of harmonics, voltage variation, unbalance and power factor to find why equipment trips, overheats or fails, and what will fix it.
How Power Quality Analysis works
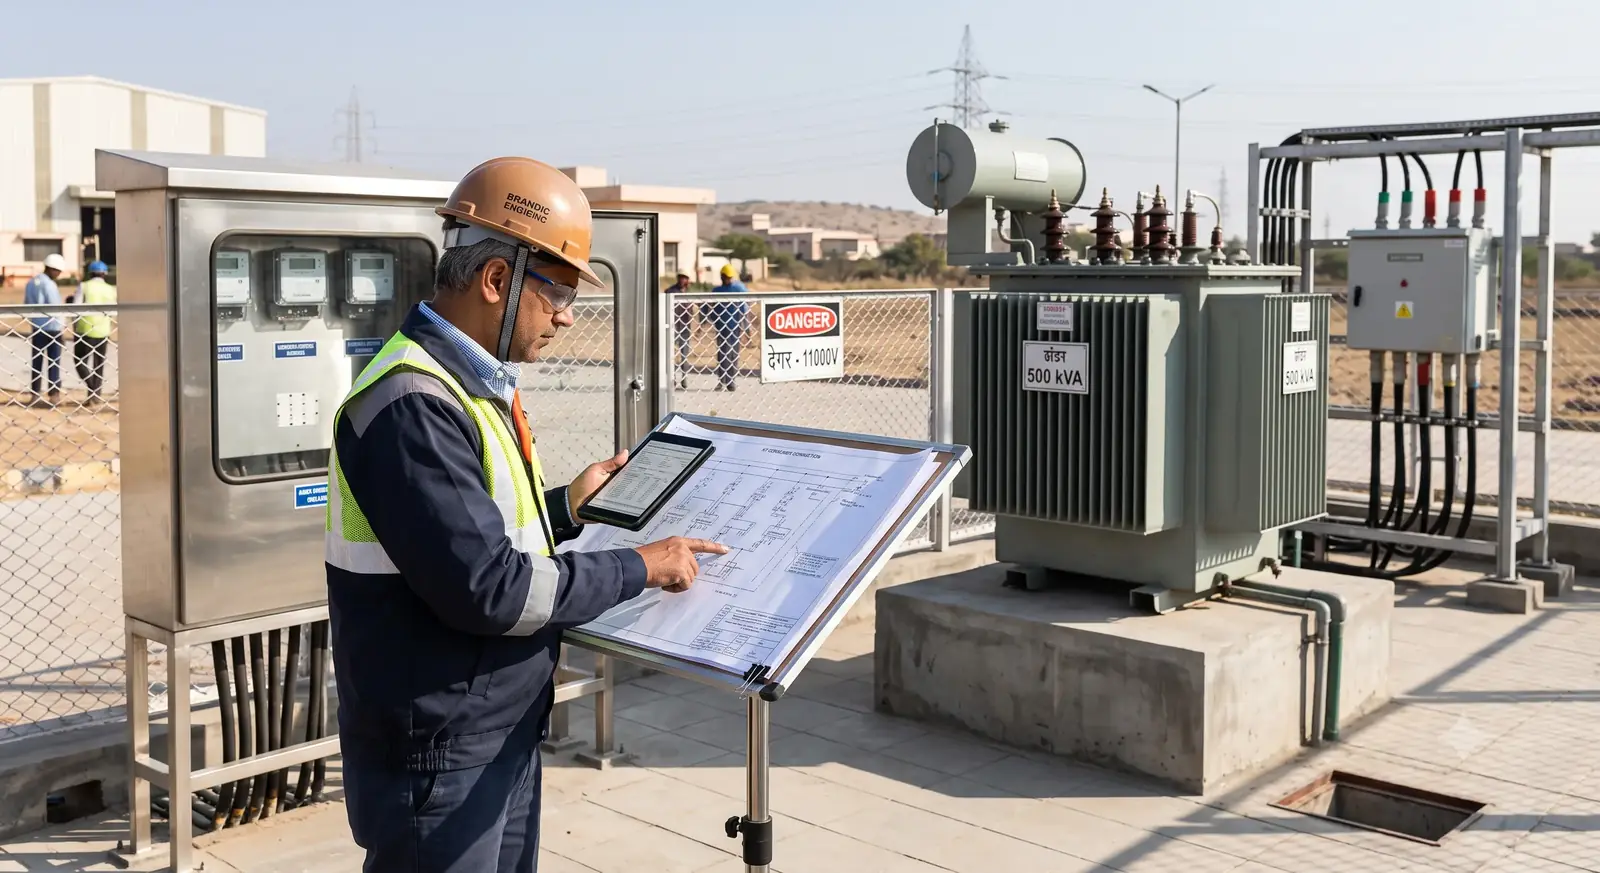
Drives, UPS systems, LED lighting, welding and solar inverters change the shape of the current they draw. The result can be harmonics, overheating neutrals and transformers, nuisance tripping, failed capacitors, flickering lights and equipment that fails early.
We connect a power quality analyser at the main incomer and at problem feeders and log for several days through your normal operating cycle. The study reports voltage variation and dips, harmonics in voltage and current, unbalance, flicker, power factor and demand, compared with the applicable limits.
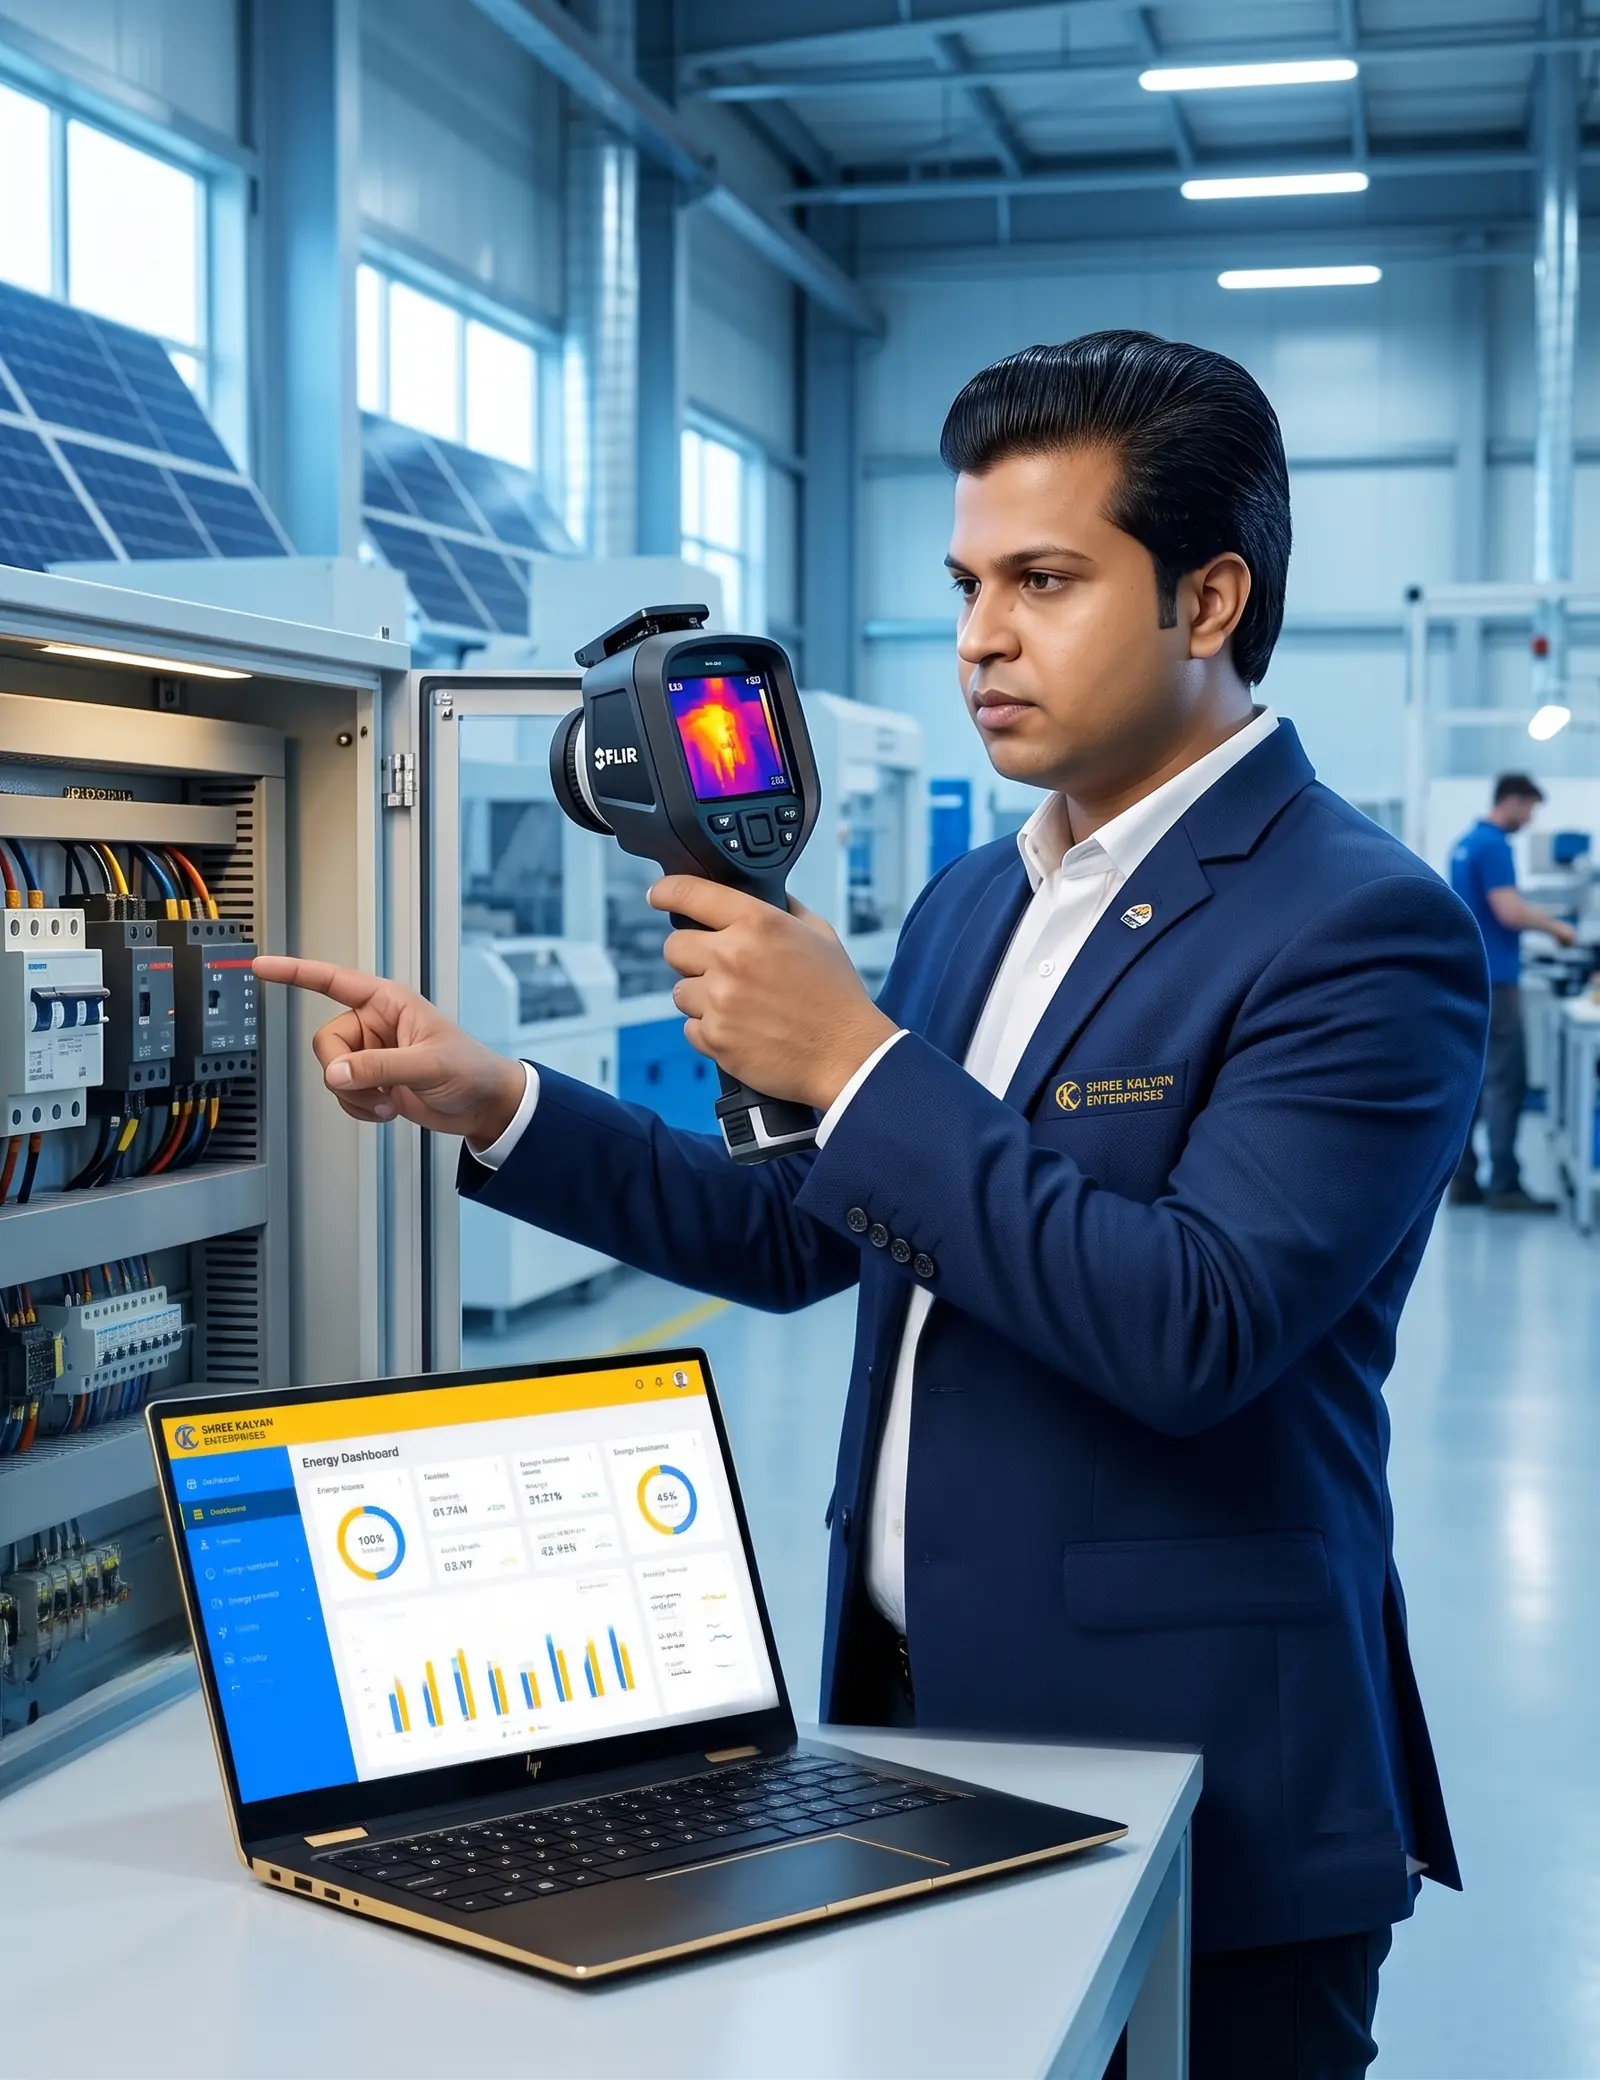
What our Power Quality Analysis service covers
Harmonics
Voltage and current harmonics and THD.
Voltage quality
Variation, dips, swells and interruptions.
Unbalance
Phase current and voltage unbalance.
Flicker
Short and long-term flicker.
Power factor and demand
PF, kVA demand and load profile.
Source and remedy
Where the problem starts and how to fix it.
Documents for Power Quality Analysis
- Single line diagram
- Description of the problem and when it happens
- List of drives, UPS and other non-linear loads
- Electricity bills for power factor history
Reports and approval letters
- Power quality report with graphs
- Comparison with applicable limits
- Identified sources of the problem
- Recommended remedies with sizing
Regulations behind Power Quality Analysis
- IEEE 519 recommended practice for harmonic control
- CEA Technical Standards for Connectivity to the Grid (harmonics and flicker limits)
- IEC 61000-4-30 Class A measurement methods
Power Quality Analysis in 6 steps
Logging periods are chosen to cover your normal operating cycle; a short logging period may miss intermittent problems.

- 1
Brief
Symptoms and history
- 2
Points
Where to measure
- 3
Logging
Several days of data
- 4
Analysis
Against limits
- 5
Report
Causes and remedies
- 6
Follow-up
Verify after the fix
Questions about Power Quality Analysis
Answered by our engineers. Ask us if yours is not here.
Ask an engineerWhat problems does a power quality study solve?
Nuisance tripping, overheating transformers and neutrals, failed capacitors, flicker and unexplained equipment failures are the most common.
How long do you log?
Usually several days to a week, so the data covers your full operating cycle.
Do you recommend the fix?
Yes. The report identifies the cause and the remedy, such as harmonic filters, detuned capacitors or load balancing, with sizing.
Is this needed for solar plants?
Grid-connected plants must meet harmonic and flicker limits, and a study is useful when the DISCOM raises a concern or inverters trip.
Power Quality Analysis across all 41 districts of Rajasthan
We handle this work with all three DISCOMs, from our Jaipur office. Find your area:
- Jaipur zone (JVVNL)Eastern Rajasthan
- Ajmer zone (AVVNL)Central and southern Rajasthan
- Jodhpur zone (JdVVNL)Western Rajasthan
Cities: Jaipur · Jodhpur · Udaipur · Kota · Ajmer · Bhilwara · Bikaner · Alwar and Bhiwadi · Sikar · Barmer and Balotra
Related electrical services in Rajasthan
See all 37 services Audits
Energy Audit
Detailed energy audits for factories, hospitals, hotels and buildings, led by a BEE certified energy auditor, with measured data and a costed list of savings.
 Inspection
Electrical Testing & Inspection
Pre-commissioning and periodic testing of transformers, panels, cables, relays and earthing, with formal reports for approvals, insurance and maintenance.
 Testing and condition
Thermography & Condition Assessment
Infrared thermography, calibration of meters and protection devices, and condition assessment of electrical assets to support predictive maintenance and prevent breakdowns.